How to Use Agile Metrics for Team Improvement
In a dynamic competitive environment, it is important to deliver value to customers quickly and regularly, to react quickly to changes in the market, and to become more resilient. But how do you know you are on the right track or have already reached your goal? As there are so many options available, you can spend days measuring something, on different levels, in different ways. Digital tools such as Trello or JIRA offer metrics for Scrum and Kanban teams, presented in nice-looking dashboards. But which metrics are most important to drive team improvement? Learn where to start and how to make great use of agile metrics as a tool for team improvement in four simple steps.
For some practical strategies to assess your team’s agility, watch the recording of our Webinar: How to Assess the Performance of Agile Teams.
What are Agile metrics?
Metrics in general are qualitative or quantitative standards that you choose and use in order to continuously improve your product, service, organization and team. You do this based on data from previous work cycles. For that reason you continuously measure specific aspects that guide you towards your goal.
Agile metrics typically relate to agile working practices and can cover many different aspects. You can measure productivity, quality and customer satisfaction, among many other things. You might also hear terms such as “agile productivity metrics”, “agile quality metrics” or “agile KPIs”.
Recommended reading: Combine your OKRs with Agile Strategy Map™ for Success
However, they are not about measuring the amount of work done – the output – but rather how much you were able to make a positive impact on the end user – the outcome. As there are so many options available, you can spend days measuring something, on different levels and in different ways. So where do you start and how do you find metrics that are useful in your context? Generally, a good starting point is to understand why and how you want to start measuring data.
Why metrics matter: Inspect and adapt
You have a current state of a product or service for which you collect data. What does this data tell you – what can you learn from it? What changes can you derive from it that could bring you closer to your goal? Will the actions taken have the desired effect?
As Simon Sinek famously says: “It all starts with why”. In this context: Measure for a purpose. You need to understand why you want to measure something and what you will do with the results. The data itself is not the goal. Instead, it is about continuously tracking your journey, testing hypotheses, and providing feedback as you head towards your goal.It also nurtures self-management within teams as communication around metrics can promote openness, transparency, and creativity.
Three agile metrics to start with
Lead time and cycle time to improve service delivery
Lead time describes the time required to complete tasks from the time of commitment. Let’s assume that a coffee delivery service receives a new order. Three minutes pass before the order arrives and is processed at the coffee machine. It takes another seven minutes from the time the coffee is processed to the time it is delivered. The processing time at the coffee machine represents the cycle time.
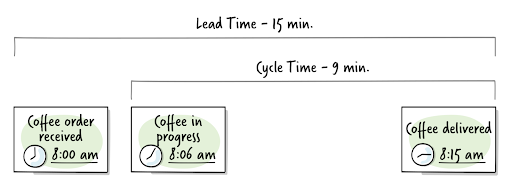
Lead time and cycle time provide important details for meeting customer expectations and give indications of possible optimization approaches. For example, it can be determined whether an excessively long processing time can be remedied by optimizing order acceptance or the coffee making process. Lead time and cycle time also improve predictability because they trigger valuable conversations about planning and customer value delivery.
Recommended reading: Simon Sablowski and Lothar Fischmann describe how they helped a team improve their service delivery by factor 30 using Kanban
Features nobody uses to focus on customer value
Identifying features nobody uses can help to trigger conversations about customer outcome value. Who is the target user and what challenge should the feature solve from the user’s perspective? If the intended outcome is still relevant, you can dig deeper and figure out what needs to be improved to create value. This could also be a starting point for additional research or doing A/B tests.
To measure features nobody uses, you could use digital analytics tools that gather data like click rates or heat maps. In case you are not able to use analytics tools, you could conduct surveys, customer interviews or observe the customer using your product.
Net Promoter Score® as an indicator of customer satisfaction
The Net Promoter Score® (NPS®) is a metric that indicates customer satisfaction and loyalty. It is based on a customer survey which consists of only one question: How likely are you to recommend our product/service to a friend or colleague?
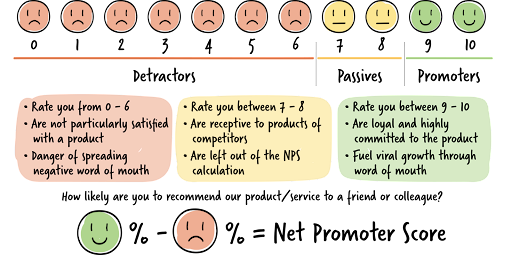
Customers can usually rate on a scale from zero to ten and optionally provide some written comments on why they have chosen a particular number. Customers who rate below 7 are considered detractors who are not satisfied with your product or service and might spread negative word of mouth. Passive customers rate with 7 or 8 and might be receptive to offers from competitors. Customers who rate 9 or 10 out of 10 are considered promoters who are loyal and committed to the product. They might spread positive word of mouth.
The NPS® focuses on customers’ satisfaction with existing products or services and focuses on an outcome. Detailed responses or comments can be used to identify concrete improvements. As the NPS® is a widely adopted metric, there are many options available to organize and run a survey. It is also possible to compare your product’s or service’s results with an industry average.
Common pitfalls with using metrics
In modern knowledge work, no two tasks are exactly alike, no two teams work together in exactly the same way, and no two project contexts are similar. Numbers might appear to be a solid, reliable standard of judgment and create a feeling of safety, when dealing with complexity. However, when you abstract complex situations into numbers for metrics, they inherit the same complexity.
Perhaps you have experienced that metrics are used because it’s simply expected from a team. Unfortunately, unfocused measurement and comparison undermine the foundations of agile approaches: They create a climate in which teams try to optimize for metrics rather than delivering the best product or service possible. This usually happens when an organization focuses on measuring output instead of outcome. Metrics that are supposed to promote orientation then cause undesirable behavior and thus poor results.
An example of this is the comparison of story points different teams have “delivered”. These are not comparable because each team uses their own sizing. The number of story points can easily be manipulated by splitting or estimating items differently and has nothing to do with the actual value delivered to the customer. Eric Ries, author of Lean Startup, calls these metrics vanity metrics because they look good and make you feel good but represent no real value.
“Tell me how you measure me, and I will tell you how I will behave.”
– Dr. Eli Goldratt
It is not surprising that some people react negatively to metrics. People will be more committed to metrics if they meet the following criteria:
- They are purposeful and focus on continuous improvement
- There is a clear connection to your goals
- A team focuses on a few important metrics
Metrics are only useful if they drive continuous improvement. Being able to select the right metrics is crucial.
Four steps to use metrics as a tool for team improvement
Step 1: Determine your goal
To ensure that you collect appropriate data, you should first know your goal of measuring something:
- What do you want to achieve?
- How will you know later that you have achieved my goal?
- Which things influence it?
- For what purpose do you want to measure what data?
- Whom does this affect in each case and how? One team, several teams, the entire organization, specific products?
Often the goals relate to the following six areas:
- Value: Are you meeting the customers’ needs? Are you serving internal needs and values as well?
- Predictability: The ability to plan and deliver customer value
- Productivity: Delivering more value in the same time or with the same resources
- Quality: A product or service that is free of defects and problems and meets customer expectations to the best of its ability
- Consistency: The ability of a team to maintain this pace indefinitely
- Growth: Is the team growing and learning?

By tomertu on Canva
Step 2: Define metrics based on principles
Choosing the right metrics requires an understanding of the target and its influencing variables. All relevant people must be involved so that the connections are clear.
Some of the principles worth following in setting the agile metrics for your team include:
- Each metric should be specific to the project, product or service and should give meaningful information to team members and other relevant stakeholders
- Team members should understand the value of measuring each metric, so they can use and apply them in their self-improvement efforts
- Metrics should be considered in conjunction with one another, and not as standalone indicators. This also ensures that metrics are not used as an end in themselves and may encourage undesirable behavior.
Additionally, ensure that metrics address not only negatively associated symptoms, but a positively associated change in root causes. This can be done with the help of leading and lagging indicators. A leading indicator is a predictive measurement that can be used to influence change, whereas a lagging indicator is an outcome measurement that can only record what has happened.
Here’s an example: Based on its ongoing measurements, an e-commerce team has noticed a decrease in recent sales numbers. The hypothesis is that there are defects in their checkout process that prevents some customers from placing an order. For this purpose, the bug rate is to be measured. The bug rate shows as an actual state that something should be improved.
Assuming that the team measures the occurring bugs in a certain period of time, it can also see a positive development. However, it cannot prevent the occurring bugs by this – This is why the bug rate is a lagging indicator. It would be better to additionally measure the test coverage, so that bugs do not occur in the first place, e.g. through the use of automated tests. These “target” states are referred to as leading indicators – They show the extent to which the target state has been achieved.
Step 3: Use metrics as a trigger for conversations
After defining what you want to measure, why, and how you measure, the real work begins: What does the data tell you? What can you learn from it? To use metrics as a tool for positive change, it is critical how you incorporate them into your communications and actions.
- Ask curious questions and go deep: Think of metrics like signals. They don’t mean much by themselves, but they indicate what we should look into more. If your team’s delivery rate is low, ask the team if they’re struggling with something that prevents them from completing work.
- Encourage the team to put metrics into context and let them tell stories about what has happened: “Do you see where our number of bugs starts to drop? That’s where we changed the way we test our code.” is more meaningful than “The number of our bugs is going down – We were able to increase quality.”
To make this kind of communication a habit, positive experiences are particularly good as a starting point for further improvement: What did we change to improve? What have we learned that we may apply in another context?
- Prefer trends over raw numbers: Good data is not available in all cases but even if the numbers are inaccurate, trends can tell us something. Is the team’s delivery rate erratic? Is the number of errors decreasing? In many cases trends matter, even when exact numbers are hard to get. Trends can also be helpful early warning systems.
Step 4: Create a good habit
By being honest and transparent about what and why you measure, you can support your teams by thinking long-term about values, intentions, and purpose. The measurement then is followed by value-oriented discussions and focused on actual steps towards continuous improvement. Incorporating these conversations about metrics into your already existing meetings ensures continuous improvement. Usually, retrospectives are a great environment to do this.
Recommended online course: Facilitating Retrospectives
Conclusion
To make great use of metrics as a tool for team improvement, there is no “one size fits all” solution available to identify the most important metrics. Cultivating a good conversation about metrics, testing hypotheses and focusing on continuous improvement is a journey and you can start this with any simple measurement. It’s not about numbers, it’s all about impact.


'%3e%3cg id='Final-Copy-2_2_' transform='translate(1275.000000, 200.000000)'%3e%3cpath class='st0' d='M7.4,12.8h6.8l3.1-11.6H7.4C4.2,1.2,1.6,3.8,1.6,7S4.2,12.8,7.4,12.8z'/%3e%3c/g%3e%3c/g%3e%3c/g%3e%3cg id='final---dec.11-2020'%3e%3cg id='_x30_208-our-toggle' transform='translate(-1275.000000, -200.000000)'%3e%3cg id='Final-Copy-2' transform='translate(1275.000000, 200.000000)'%3e%3cpath class='st1' d='M22.6,0H7.4c-3.9,0-7,3.1-7,7s3.1,7,7,7h15.2c3.9,0,7-3.1,7-7S26.4,0,22.6,0z M1.6,7c0-3.2,2.6-5.8,5.8-5.8 h9.9l-3.1,11.6H7.4C4.2,12.8,1.6,10.2,1.6,7z'/%3e%3cpath id='x' class='st2' d='M24.6,4c0.2,0.2,0.2,0.6,0,0.8l0,0L22.5,7l2.2,2.2c0.2,0.2,0.2,0.6,0,0.8c-0.2,0.2-0.6,0.2-0.8,0 l0,0l-2.2-2.2L19.5,10c-0.2,0.2-0.6,0.2-0.8,0c-0.2-0.2-0.2-0.6,0-0.8l0,0L20.8,7l-2.2-2.2c-0.2-0.2-0.2-0.6,0-0.8 c0.2-0.2,0.6-0.2,0.8,0l0,0l2.2,2.2L23.8,4C24,3.8,24.4,3.8,24.6,4z'/%3e%3cpath id='y' class='st3' d='M12.7,4.1c0.2,0.2,0.3,0.6,0.1,0.8l0,0L8.6,9.8C8.5,9.9,8.4,10,8.3,10c-0.2,0.1-0.5,0.1-0.7-0.1l0,0 L5.4,7.7c-0.2-0.2-0.2-0.6,0-0.8c0.2-0.2,0.6-0.2,0.8,0l0,0L8,8.6l3.8-4.5C12,3.9,12.4,3.9,12.7,4.1z'/%3e%3c/g%3e%3c/g%3e%3c/g%3e%3c/g%3e%3c/svg%3e) Your Privacy Choices
Your Privacy Choices